Slides
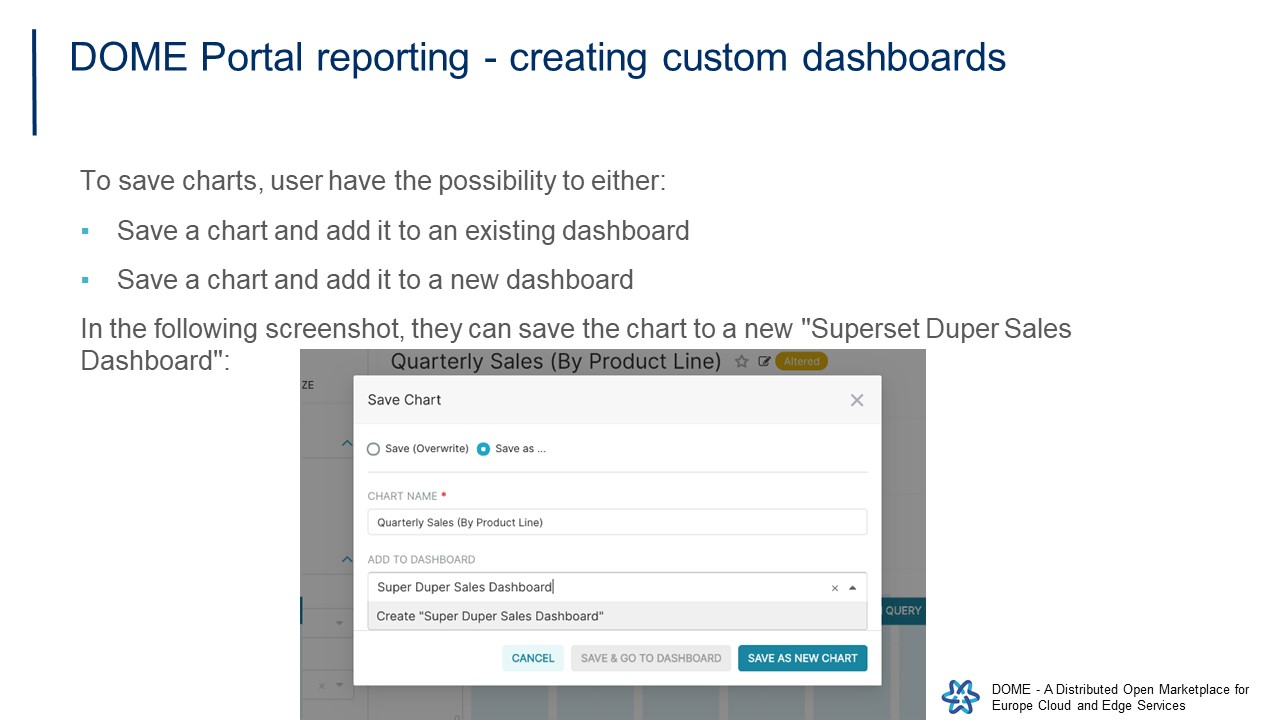
DOME Portal reporting features for Customers and Providers

Users have automatically available data associated with their interactions in DOME ecosystem, as well as statistics in DOME portal.
Preconfigured KPIs, charts kai dashboard can be available through the relevant sub-menus.
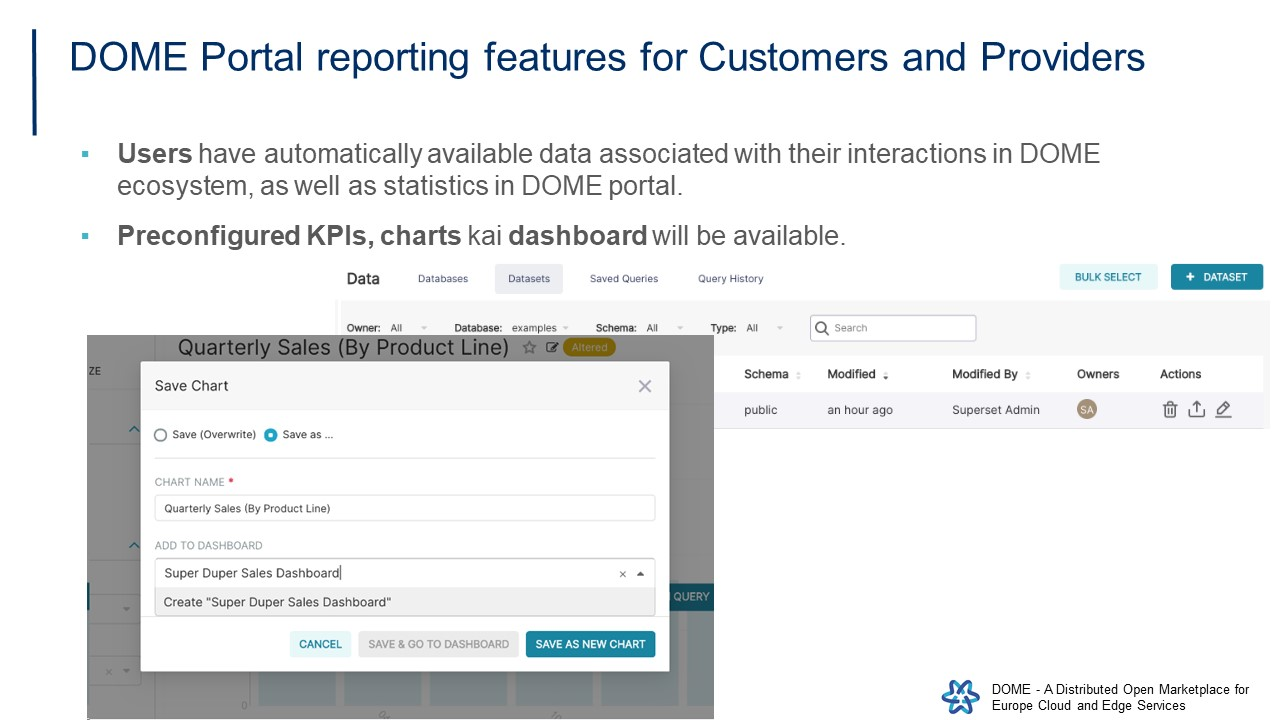
There are 2 main interfaces for exploring data and creating custom charts are available through superset:
-Explore: no-code viz builder. Select your dataset, select the chart, customize the appearance, and publish.
-SQL Lab: SQL IDE for cleaning, joining, and preparing data for Explore workflow
We focus on the Explore view for creating charts. To start the Explore workflow from the Datasets tab, we can start by clicking the name of the dataset that will be powering your chart.
A powerful workflow for exploring data and iterating on charts is available.
The Dataset view includes a list of columns and metrics, scoped to the current dataset you selected.
The Data preview also provides users with helpful data context.
Using the Data tab and Customize tabs, users can change the visualization type, select the temporal column, select the metric to group by, and customize the aesthetics of the chart.
As users customize the relevant chart using drop-down menus, they can get visual feedback.
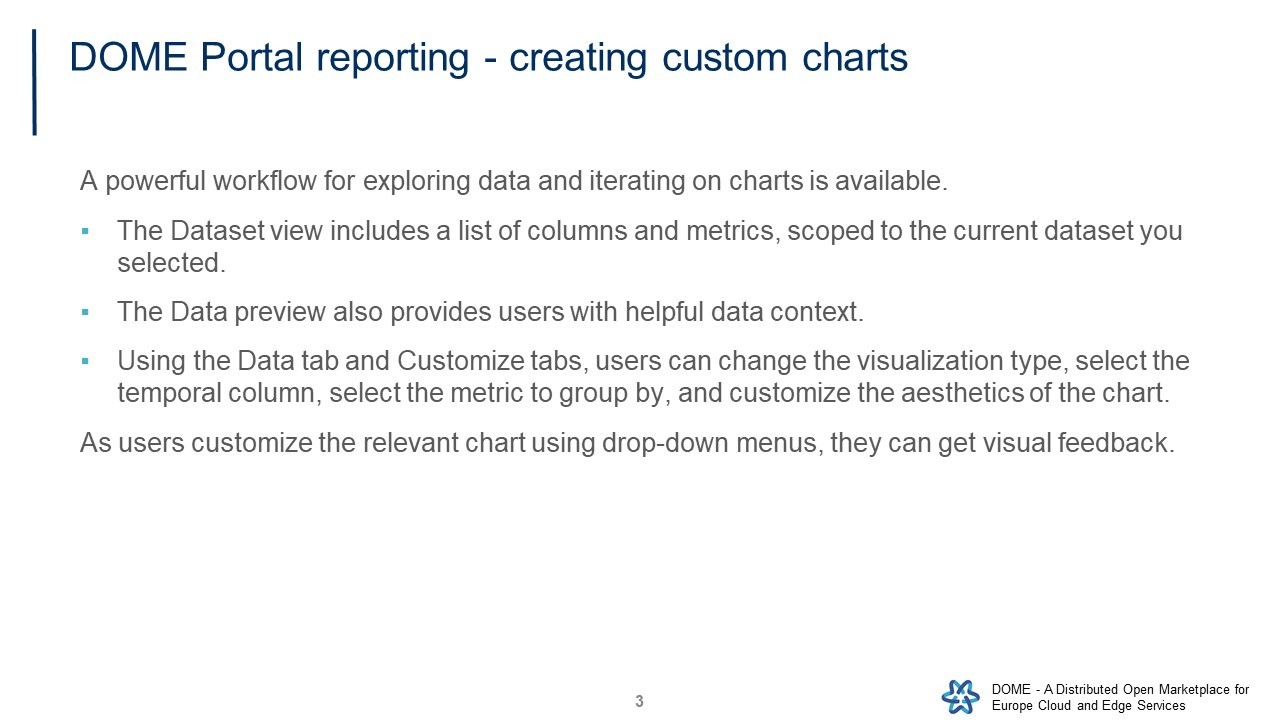
To save charts, user have the possibility to either:
-Save a chart and add it to an existing dashboard
-Save a chart and add it to a new dashboard
User can save the chart to a new "Superset Duper Sales Dashboard".
